IIoT PdM Solutions for Coal Preparation plant
Alpha Ind. Tech.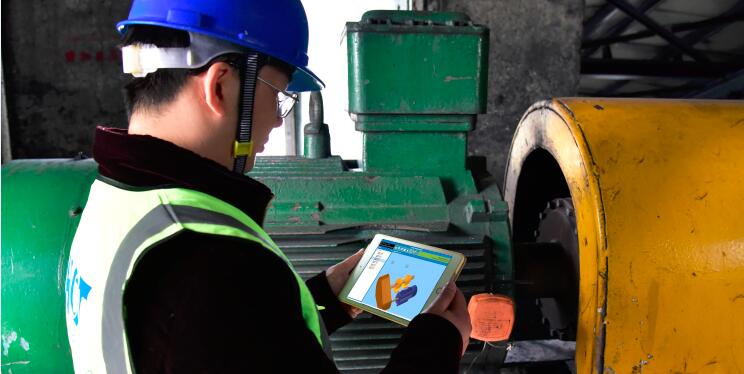
IoT-Based Monitoring & Warning System for Coal Preparation Plant
Powered by Alpha Industrial Technology Pty Ltd
General Introduction
This system is aimed at the wireless monitoring on vibration and temperature of key parts of the main equipment of the coal preparation plant. The measuring points are mainly distributed in the main motor, reduction gearbox, roller and other vibration and temperature measuring points.
At same time, other existing systems can obtain the data of this system through the server. The IoT-Based Monitoring & Warning System is mainly used to measure the vibration and temperature of mechanical rotating equipment, which use build-in acceleration sensor to measure vibrating signals in two directions and use thermal resistance sensor for temperature measurement. It can show the acceleration single peak value, kurtosis, velocity value (intensity), temperature and battery power in two directions. Operators can check the historical state trend and check the running status at any time. What’s more, this system has alarm function, which can achieve the purpose of active protection and pre - known maintenance, it can also improve the continuous operation cycle of the equipment and reduce the time and cost of maintenance.Using wireless data transmission,it perfectly solved the problem of hard to do wiring construction in the field.
1.1 System architecture
1.1.1 System hardware composition diagram
The IoT-Based Monitoring & Warning System for coal preparation plant is composed of wireless terminal, wireless repeater, network switch and server.
The wireless monitoring terminal (including acceleration sensor and temperature sensor) collect vibration of each measurement point(in two directions) and temperature data, then transfer the data to repeaters through 2.4GHZ wireless frequency channel.
The wireless repeaters are connected with in-plant LAN through optical cable and reticle and transfer data to database sever which is installed with monitoring software.
1.1.2 System data flow chart
The wireless terminal collect data to wirelessly transfer to repeaters, then repeaters send data to server collecting program through network, then server collecting program write the collective data to database after collecting data. Using Opcua as interface routine to achieve the data change between database and site monitoring system.
1.1.3 Software structure description
(1) B/S structure: using browser-sever structure(B/S), operators can log in and access database sever directly through browser in internet of company. There is no need to install any client software. It can achieve all functions including observing data list, real time curve, hysterical curve, state alarm.
(2) Sever complete data collection, data storage, data analysis and communicate with other systems.
(3) Client side is based completely on browser’s application which can achieve data visualization and system configuration operations in the browser.
(4) Transaction processing logic: main Transaction processing logic is completed in sever side, a small portion is achieved in browser, which is user-friendly and easy to operate.
(5) Maintenance and upgrade methods: All running programs are deployed on the server side, maintenance and upgrades can be done by updating the server-side program.
(6) Database layer: Database layer archives the system data information using relational database, support SQL search, supply database management tool, easy to check, manage and backup database which can insure data integrity and reliability. Database layer is mainly composed of database sever and database software.
1.1.4 Point layout table (One project for example)
The table below is the table of vibration measurement points, and the number of terminals of the vibration measurement points is included in the temperature measurement points, so the vibration measurement points do not account for the actual number of terminals.
Device name | Spot check position | Spot check content | ID position | Signal type | Terminal number | Repeater number |
Belt conveyor | Motor drive side | Radial⊥Vibrate
| Vibrate | 1 | 1 | |
Radial⊥Vibrate
| ||||||
Reducer high speed shaft side | Radial⊥Vibrate
| 1 | ||||
Radial⊥Vibrate
| ||||||
Scraper conveyor | Motor drive side | Radial⊥Vibrate
| Vibrate | 1 | Share | |
Radial⊥Vibrate
| ||||||
Reducer high speed shaft side | Radial⊥Vibrate
| 1 | ||||
Radial⊥Vibrate
|
1.1.5 Component configuration list
No. | Project | Model | Quantity | Unit | Remark |
1 | Wireless monitoring terminal | 5 |
Set | ||
2 |
Wireless repeater | 2 |
Set | Prevention of bad signals, 1 repeater for spare | |
3 | Wireless monitoring and analysis software | 1 |
Set | ||
4 | Terminal installation accessories | 5 |
Set | ||
5 | Power cable
| Meter | |||
6 | Fiber cable
| Meter | |||
7 |
Optical switches |
Set | |||
8 | Field explosion-proof junction box |
Set |
Remarks:
Only the components in the list are provided, and other components needed in the installation of the project, such as servers, switches, network lines, etc., are provided by Party A.
1.2 System function
(1) Monitoring functions: process equipment connection diagram, single equipment and group drawing, real-time list, real-time trend, historical trend, real-time alarm.
(2) Alarm function: alarm record, alarm query. All data alarm values can be set.
(3) Analysis function: trend analysis.
(4) Monitoring parameters: vibration acceleration (Single peak value), kurtosis, vibration speed (effective value), equipment temperature, battery power.
(5) Time interval: 15 seconds to 10 minutes, it can be configured flexibly. It can be adjusted according to the needs of users. The minimum interval time also depends on the number of sensors under a gateway.
(6) The relationship between the monitoring time interval and the energy consumption of the battery (ambient temperature of 20℃ ).The following table is the test data for reference only.
Interval setting | Time interval of data acquisition | Battery life |
1 | 15 seconds | 4 to 5 months |
2 | 30 seconds | 10 months |
3 | 1 minutes | 1 year |
4 | 5 minutes | 2 years |
5 | 10 minutes | 3 years |
1.3 Software functional interface (reference)
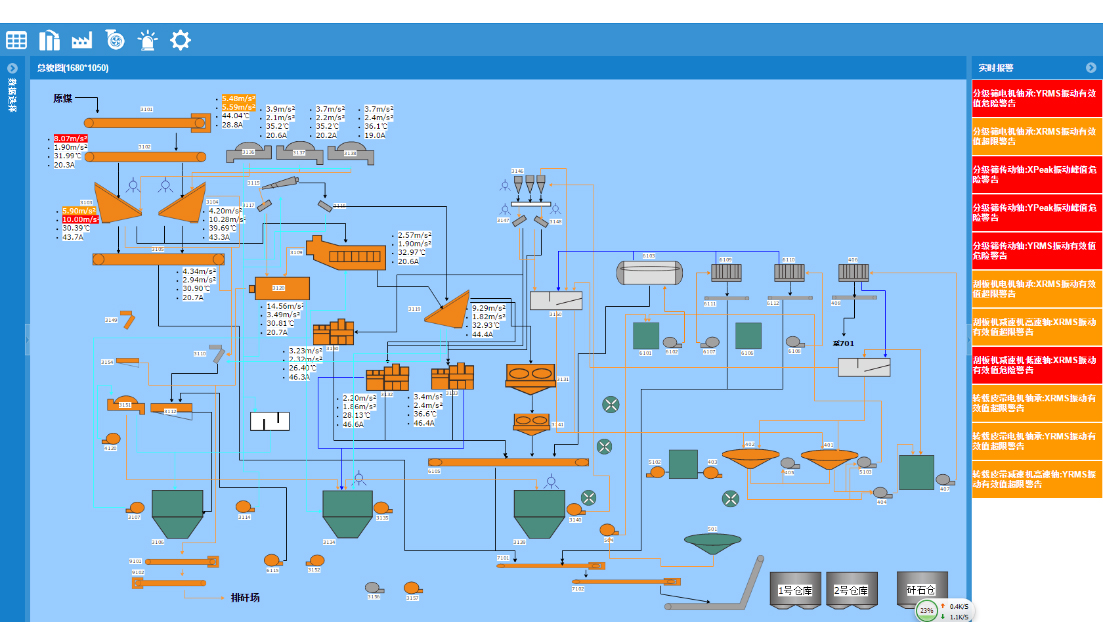
Chart 1 Process equipment connection diagram
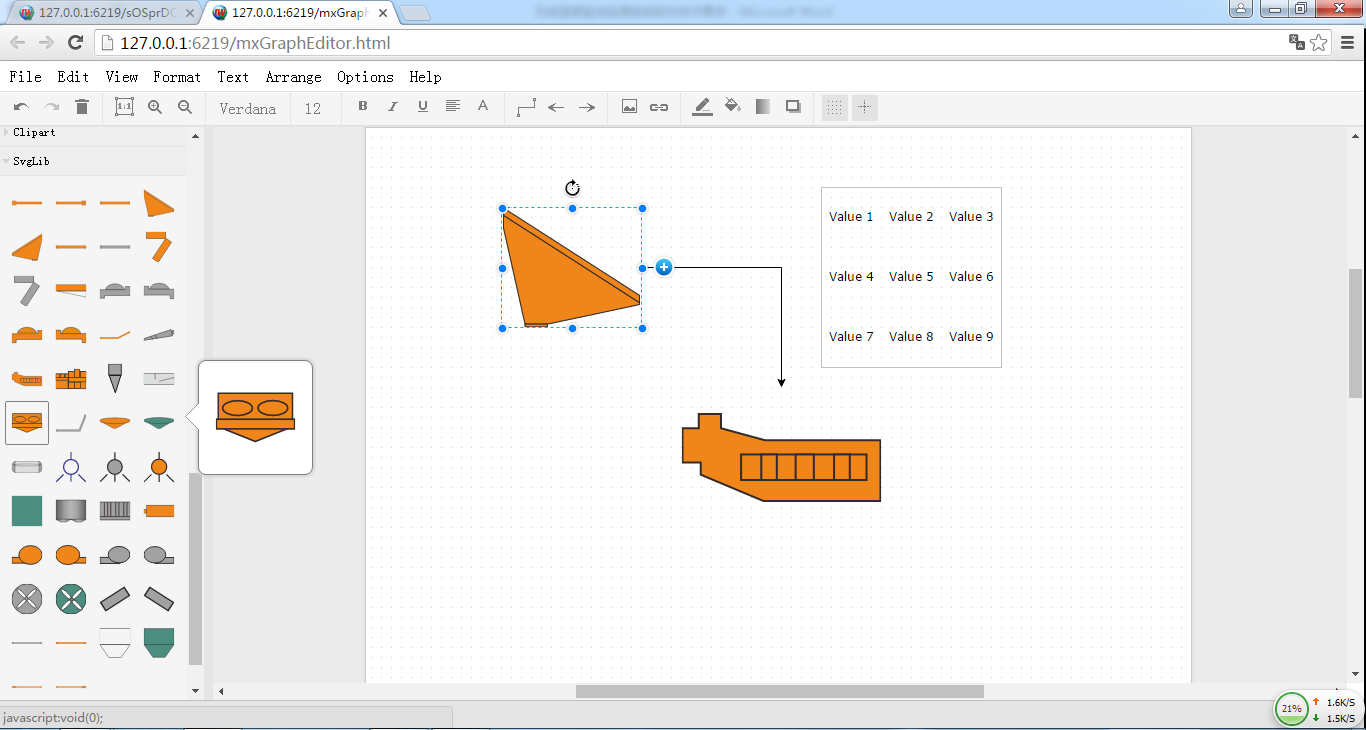
Chart 2 Online process equipment connection diagram editing configuration
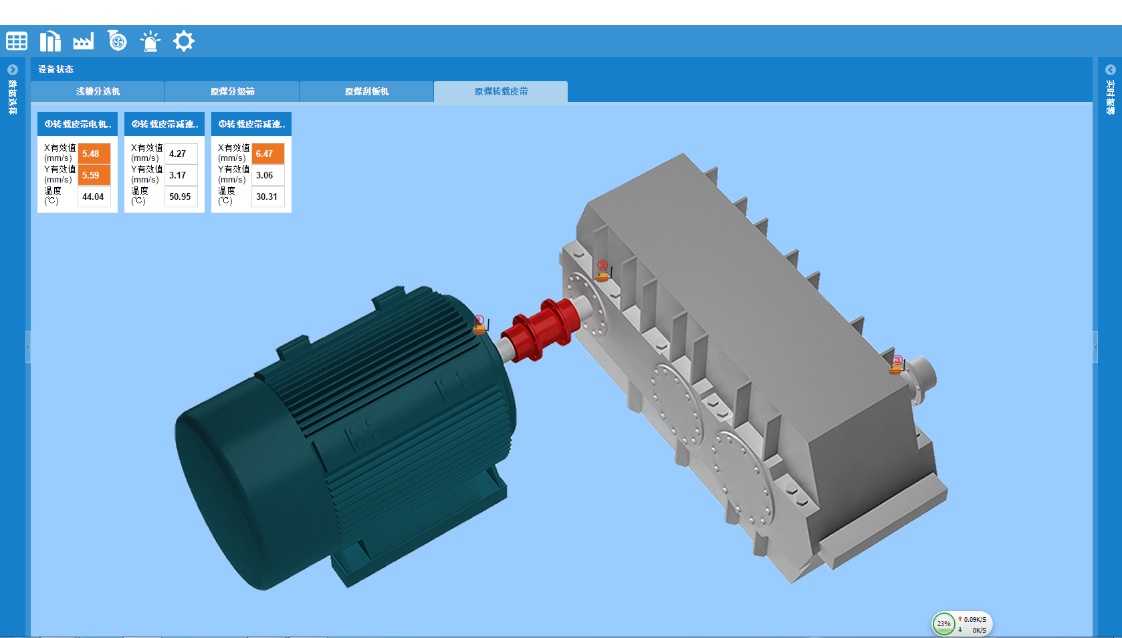
Chart 3 Single equipment and group drawing
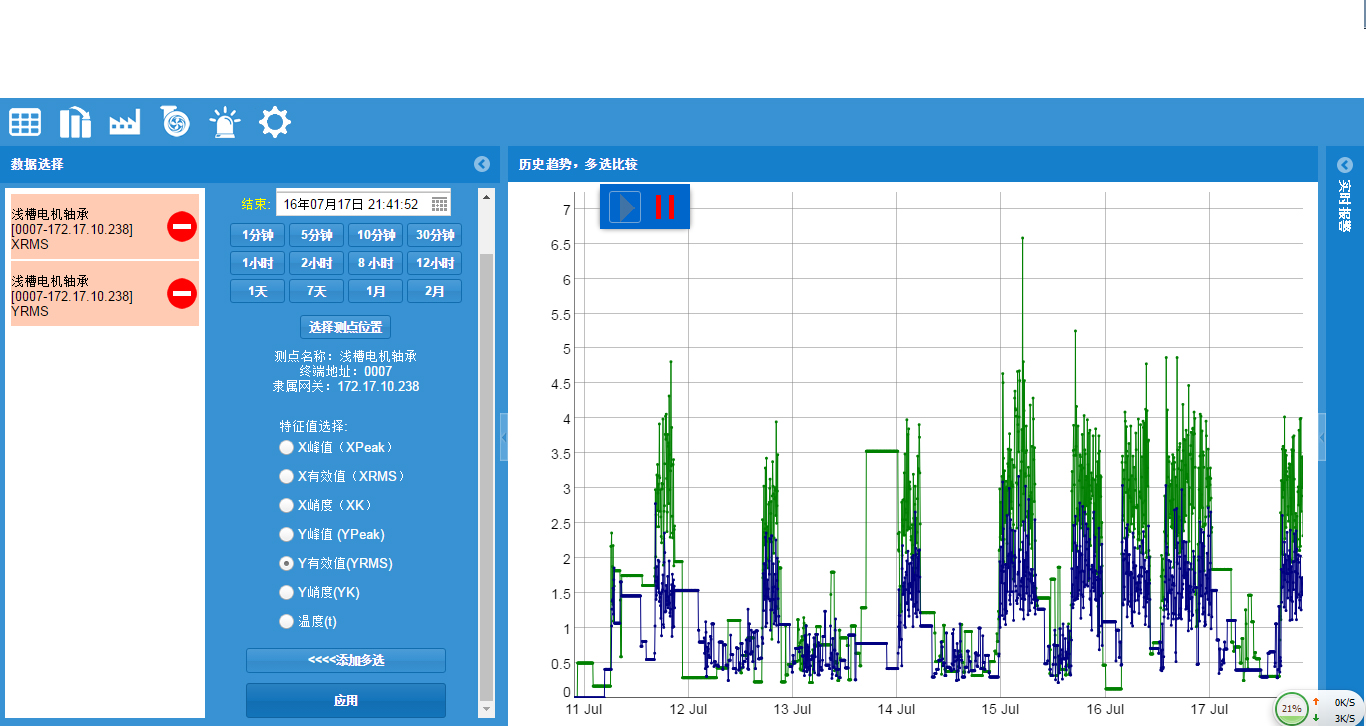
Chart 4 Real time trend diagram
1.4 Hardware configuration parameters
1.4.1 Wireless monitoring terminal
Vibrate | Range | 16g (peak value) |
Measurement interval | 15 to 10 minutes (the minimum interval is also dependent on the number of sensors under a gateway) | |
Temperature | Measuring range | -40~200℃ |
Resolving power | 1℃ | |
Measurement interval | 15 to 10 minutes (the minimum interval is also dependent on the number of sensors under a gateway) | |
Communication | Way | wireless |
Distance | 1000 meters (open ground) 300 meters (visible distance within the workshop) extreme | |
Power Supply |
Model | One C type non rechargeable lithium battery, nominal 3V |
Service life | Determined according to time interval | |
Protection and explosion protection | Protection grade | IP66 |
1.4.2 Wireless repeater
Communication mode with sensor | wireless |
Communication with the server | Wired |
Power Supply | 220V@50Hz |
Protection grade | IP66 |


